
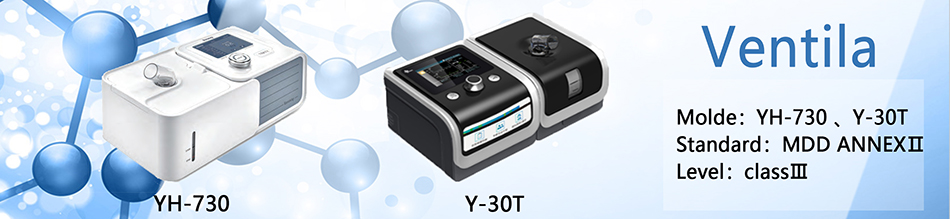


Equipment

1. Company Profile
Phi Optics Co., Ltd. was founded in the United States in 2009 by Ph.D. in Optics and Ph.D. in Materials Science. The company is committed to developing quantitative phase contrast imaging equipment to meet market demand. Based on its quantitative phase contrast imaging platform, Phi Optics is developing next-generation optical imaging system. The goal of the Phi optics platform is to compete with traditional optical microscopes in a variable vertical market, supported by a large number of patent protection certificates and the continued development of Phi Optics. The company is mainly engaged in development and application of life science, medical diagnosis and nanotechnology, semiconductor technology.
The Phi Optics technology platform uses standard tools and processes, combining the function of traditional tunable optical microscopes (such as fluorescence, DIC, phase contrast, etc.) with real-time 3D tomography to quantify phase contrast imaging. Its integration provides a very prominent advantage for requiring low cost, fast, accurate quantification of nanomaterials. At present, the system has installed more than 200 units in the world, and there are numerous publications.
2. Product Description
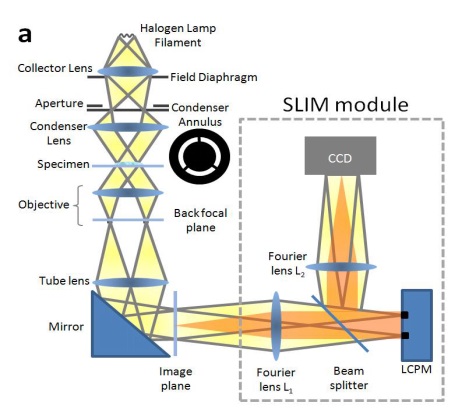
Phi Optics SLIM technology integrates phase contrast microscopy technology with holographic imaging technology, which is a non-intrusive space optical imaging technology. It adopts a unique four-wave transverse shear interferometry patented technology, it uses white light imaging of spatial incoherent light source, and reference light and irradiated light pass through samples, which are not affected by polarity change of light source, so as to ensure better transverse resolution and no light bleaching. Without staining and avoiding phototoxicity, the sample is directly transformed into a thickness, dry matter area concentration and refractive index map by the optical path difference in the sample. The SLIM tool of Phi Optics can load all major brands of phase contrast microscopes (magnification from 10x to 100x), connect through C interface, and use white light of the microscope as light source. The spatial light interferometry is very sensitive for the detection of cell structure and dynamics.
3. Product Characteristics
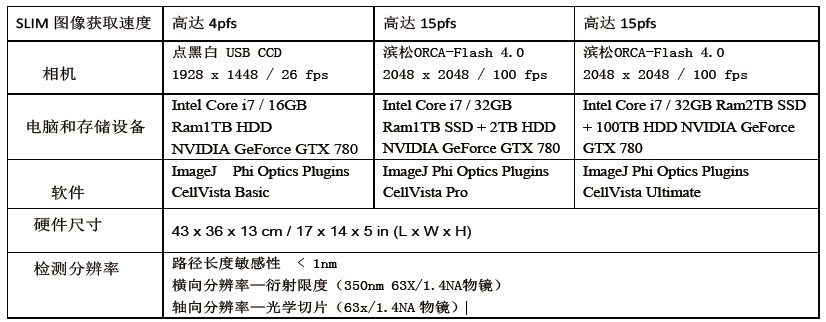
Image output: Snapshot and long-term imaging series with full camera speed and resolution (for example: 4MP full-image imaging speed is 100fps)
SLIM high contrast live cell imaging and measurement of cell and tissue concentration (quantitative plot), 32-bit TIFF:
• Phase difference drift diagram (radial)
• Dry matter surface concentration (pick per square micron)
• Height map of refractive index (micron)
• Measuring the thickness of the refractive index map
• Conventional brightfield, phase contrast, fluorescence microscopy, 8 and 16 bit TIFF images

Picture1: Unmarked imaging
Picture2: 3D tomography
Hardware system
Real-time quantitative phase contrast imaging and image display
Non-invasive, labeled cell and tissue imaging over a wide time range (from seconds to weeks)
Programmed 2D and 3D Scanning of large area 2DSLIM and 3D SLIM Images
Seamless superposition of other microchannels
Rapid and Simple Quantitative Cell Segmentation
CellVista image acquisition software
• Instant rendering of SLIM maps and long-term images
• Direct detection of sample phase difference, dry matter, thickness or refractive index
• Integration with existing optical microscopes: X-Y-Z scanning & multi-channel imaging (CellVista Pro)
Imaging contrast----and confocal imaging can be comparable to the quantitative effect of imaging
Imaging contrast----and confocal imaging can be comparable to the quantitative effect of imaging
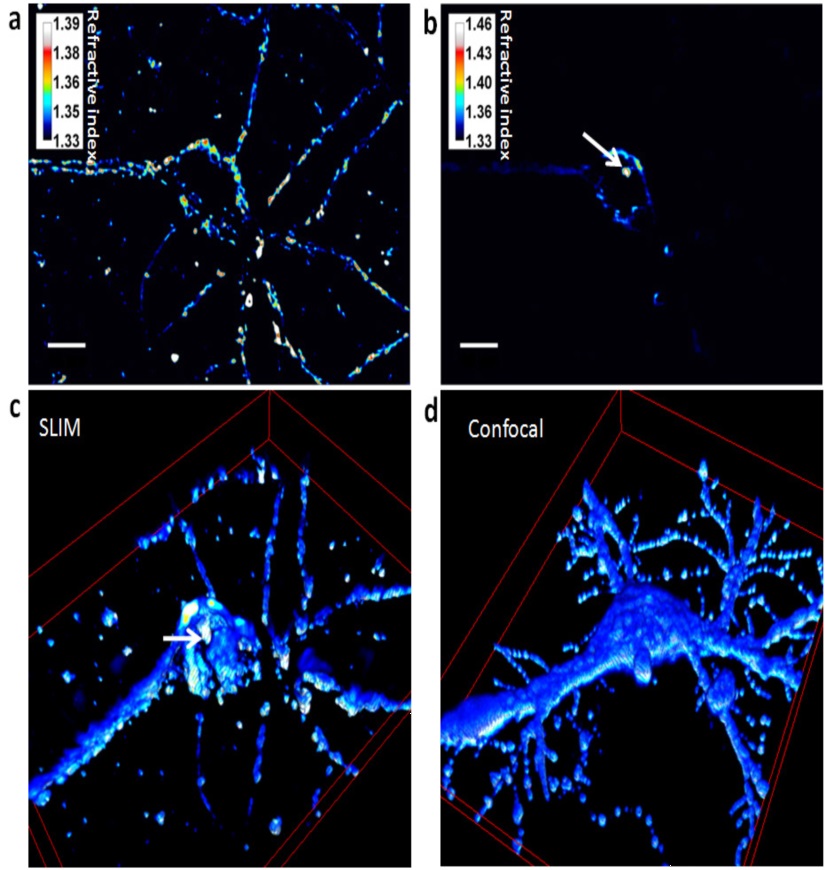
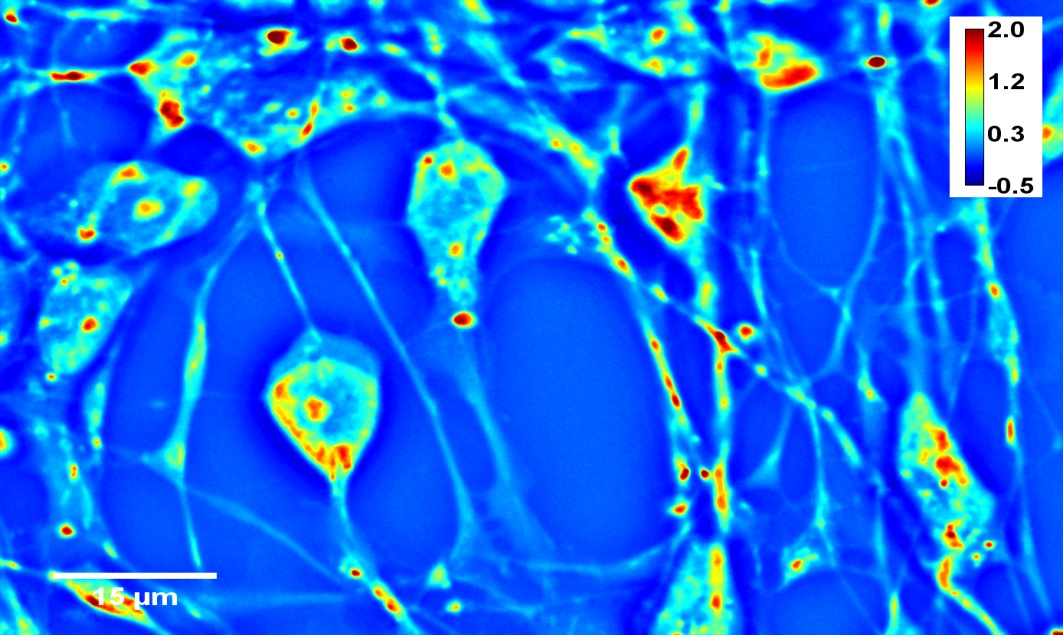
Comparison of the unlabeled neuron imaging effect using fluorescence confocal microscopy and SLIM, (Fig. d) with anti-polysialic acid IgG #735, Figure C without label, one by one comparison of the 3D map and the corresponding Z-axis stack For constructing a 3D map, the confocal numerical aperture NA = 1.2, which is higher than SLIT (SLIM tomography mode), which explains the higher resolution of confocal, and the results of SLIT imaging are similar to those of fluorescence confocal microscopy. Compared to confocal microscopy, SLIT is unmarked and can perform non-invasive imaging of living cells for a long time, using a lower power source, typically with an irradiance of 1nw/um2 in the sample plane and an exposure time of 10-50ms. Exposure is less than 6-7 orders of magnitude for typical confocal, thus reducing phototoxicity during long-lived live cell imaging, high refractive index associated with chromosome segmentation, allowing for high contrast imaging during mitosis, 4D imaging can provide new insights into cell division, mobility, differentiation, and growth; In addition, SLIT integrated microscopy and interference detection to solve the inverse scattering problem is a supplemental enhancement of existing phase contrast microscopy based on phase difference imaging for the wide range of spatiotemporal spans from discovery to quantification.
4. Applications
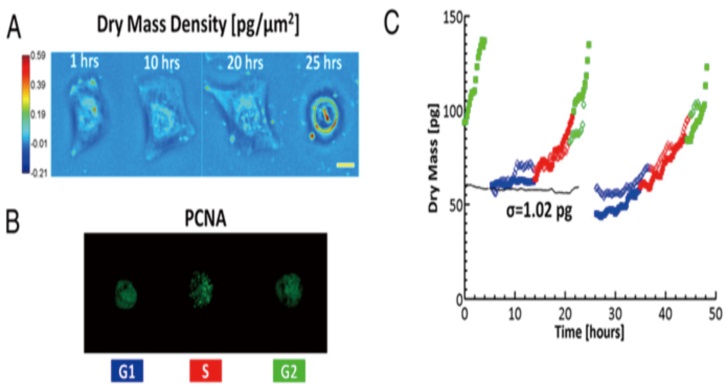
1. Cell Growth--Quantitative Analysis of Dry Matter
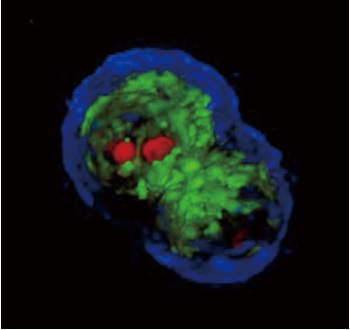
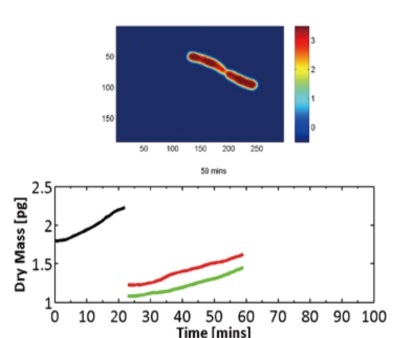
For a long time, there has been a lack of a simple method to detect the growth rate of single adherent cells of different sizes. The controversy of aging is whether the growth rate of cell life cycle is constant, whether the growth of cells is proportional to the dry matter of cells, and the variation of cells in each generation is different. Therefore, there must be a mechanism to regulate the growth, controversy has persisted because the lack of sensitive methods for quantifying dry matter in cells, the traditional Kurt method for cell size measurement is affected by osmotic pressure.
The dry matter detection of SLIM is not affected by osmotic pressure. The sensitivity of SLIM is 1.5fg/um2 and 0.15fg/um2 in time and space respectively. SLIM can detect the dry matter of many single adherent cells under different conditions. From micron to millimeters, from seconds to days, morphology from bacteria to mammalian cells, integrated spatial light interference and fluorescence imaging; provides a unique way to study cell cycle-dependent growth: fluorescent reporter group display The cell growth phase and SLIM provide non-invasive cell dry matter detection with single cell resolution (AFP grade sensitivity).
Ў¶Optical detection of cell cycle-dependent growthЈЁPNAS,2011)Ў·
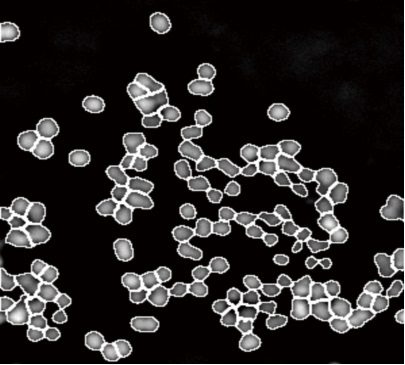
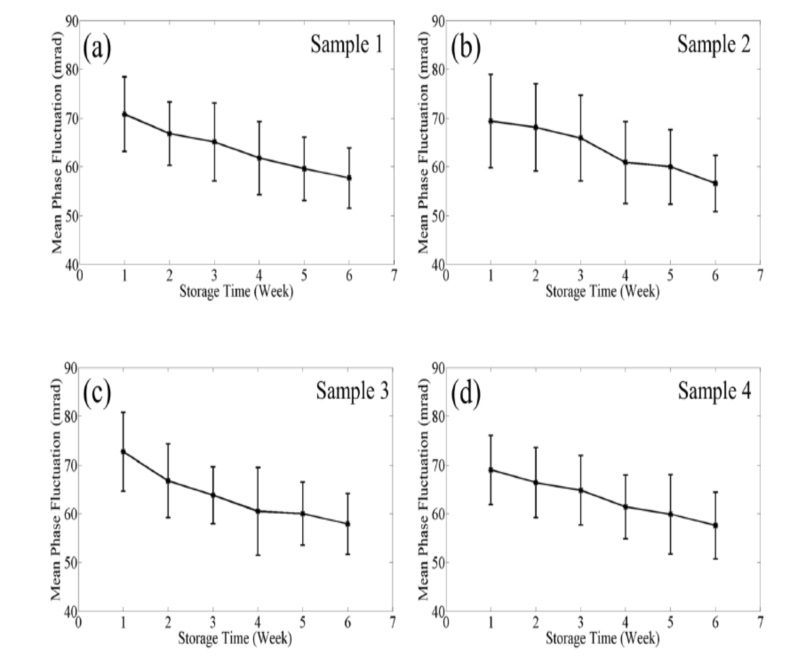
2. Label-free nanoscale measurement of red blood cell membrane changes to assess blood quality.
The blood cells (RBC) in the blood bank generally have a storage time of 42 days. As the storage time is extended, the deformation ability of the cells is weakened. The normal RBC diameter is 7-8 mm, which is only slightly wider than the microcapillaries, and they must pass through the deformation. In the microvascular network, the low-deformed RBC is either blocked in the capillary or spends more time passing through the microcirculation, resulting in a decrease in oxygen transported to the organ, and the cells with reduced deformation are eventually eliminated from the circulation in the spleen. The shape of RBC changes with increasing osmotic fragility and long-term deformation loss. The reduced membrane deformability leads to a decrease in endothelial red blood cell interaction, which in turn activates the inflammatory pathway. Previous studies have shown that optical imaging provides cell morphology information, digital holography, The non-contact method detects changes in 3D morphology and mean blood globulin concentration, but there is still no report on cell dynamics.
SLIM combines Zernike's phase difference method with Gabor's holographic method to provide a spatially uniform white light, stability and general path interference, detectable RBC film volatility, hard film volatility and deformation reduction, SLIM quantitative analysis is directly related to function, the phase difference displacement is reduced, the cells become hard, the dry matter performance is weakened, and the cells are damaged. SLIM's label-free quantitative analysis technology can quickly and directly check the quality of stored blood and optimize blood storage conditions to avoid the waste of precious blood in the blood station.
Ў¶Optical Assay of ErythrocyteFunctioninBanked BloodЎ·ЈЁScientific Reports Ј¬SepЈ¬ 2014Ј©
3Ўў Cell morphology
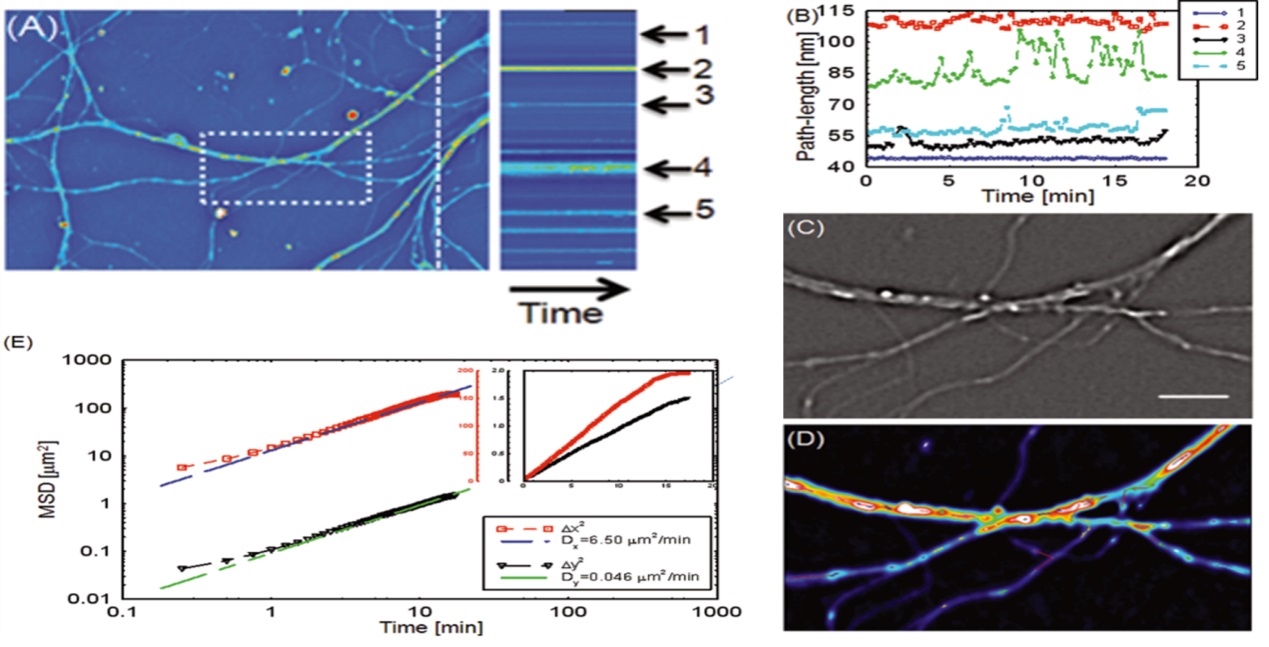
SLIM studies intracellular or intercellular dynamics by tracking small organelle movements or as a whole to analyze areas of interest, 3D tomography, the sensitivity and diffraction-limited resolution of SLIM sub-nanometers provide an ideal method for studying cell dynamics, according to the diffusion coefficient and velocity distribution, quantitative data generates actual material transport information.
4Ўў3D tomogram
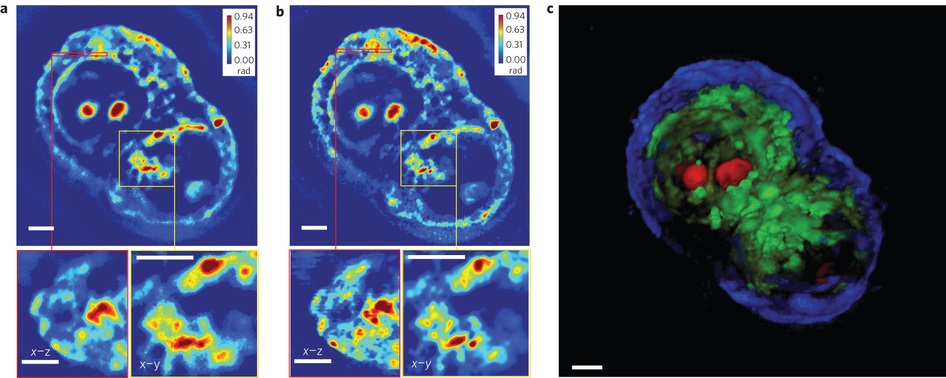
1. HT-29 3D tomogram (a) A detects the Z-axis section (top), the red area indicates the cross section (left bottom) and the yellow box indicates the area reduction picture (bottom right), detected using x63/1.4NA oil mirror; (b) The deconvoluted Z-axis section corresponds to a (top), the cross-sectional view is marked in red (lower left), and yellow is the reduced area map (lower right corner). By comparing a and b, the resolution increase can be clear. see. (C) Three-dimensional rendering of pseudo-color after deconvolution (additional animation 3), using z-axis stacking of 140 images, each dimension is 640x640. Due to the large image dimension, the image is divided into 25 sub-images for faster going Convolution processing, in general, the deconvolution process takes about 1 hour, so the scale of the channel is 5 ¦Мm. SLIM is used for live cell tomography and 3D analysis, and the acquisition of tomographic images of labeled cells is passed. The full sample focus scan sequentially acquires the image according to the cell stack cross section. The acquired stack map contains 3D information of all samples, which can further obtain information about the structure and spatial distribution of the object. The 3D rendering of the stacked image is the same as ImageJ and flexible cell observation. Based on quantifiable phase contrast images, this extends application of SLIM to scientific and clinical and other areas.
5ЎўNeuroscience
Adult progenitor neuron growth SLIM is suitable for studying neuroscience, and non-invasive live cell imaging provides a viable environment for fragile neurons and neural stem cells, which are easily acquired by the environment, chemicals or light damage, SLIM speed can directly detect the transport between neurons, and a wide range of fields can image the neural network. Therefore, SLIM provides an environment for studying neurons at the single cell and population levels.
6. Blood Test
Integrated SLIM and amplitude microscopy increase cell thickness and refractive index detection
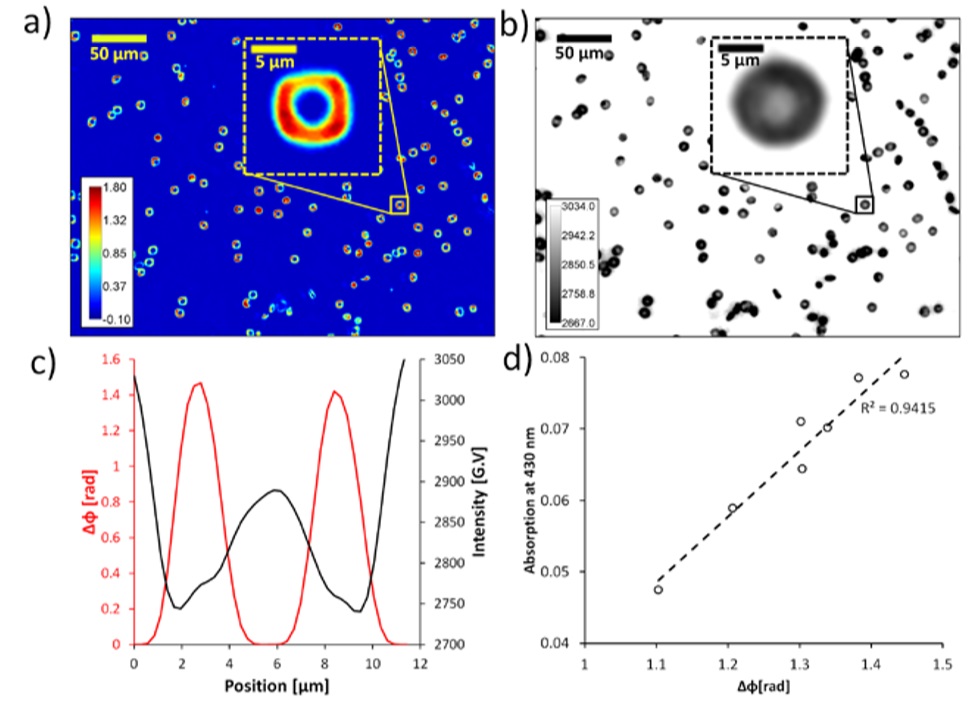
Spatial light interference microscopy can be used for blood tests, and SLIM is able to detect the thickness of blood cells (RBC), which provides a reliable way to infer the conditions of RBCs. Effective parameters from SLIM for RBCs analysis include: perimeter, projected area, roundness diameter, surface area, volume, sphericality, eccentricity, minimum height, maximum height, average height, minimum cylinder diameter, roundness, overall density, Kurtosis, partiality and variance, we combine conventional bright-area images for absorption detection, SLIM can also infer information about hemoglobin concentration.
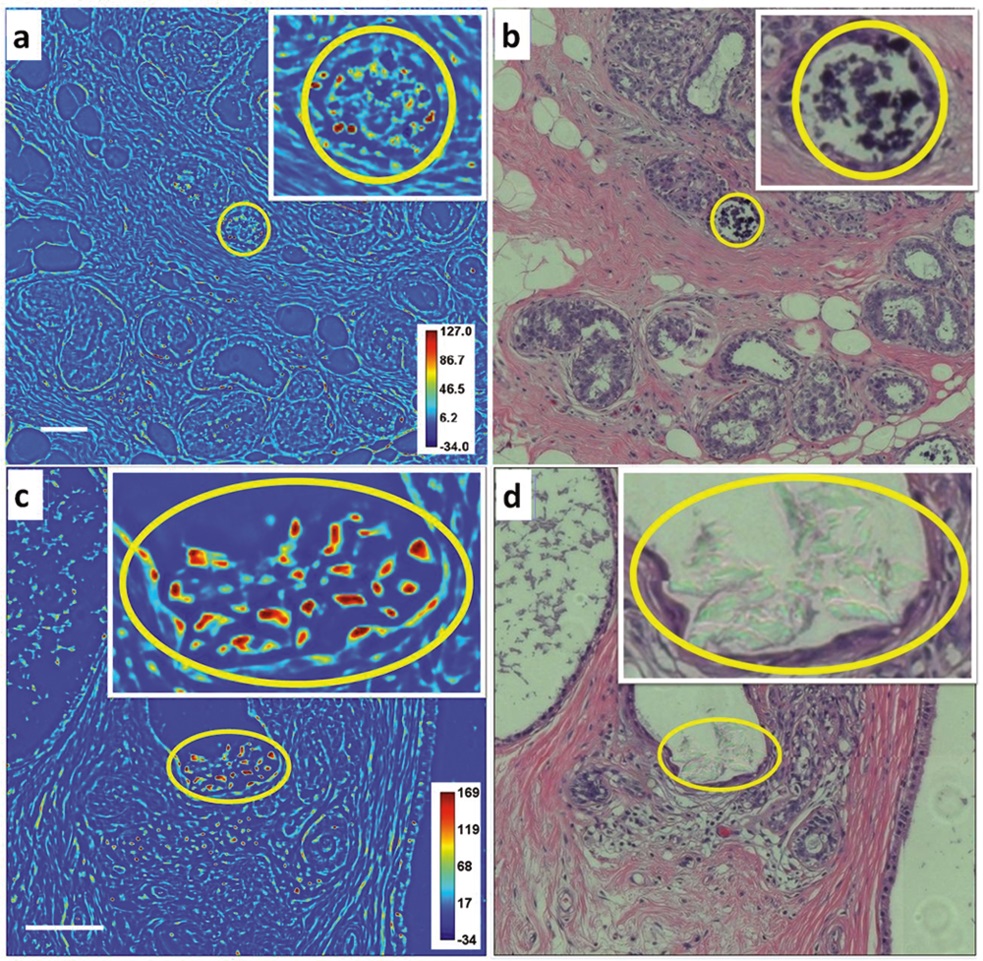
 7. Tissue Imaging
SLIM, microscopic calcium imaging of breast cancer, calcium phosphated breast cancer tissue
SLIM imaging (a) nanoscale color bars; H&E images; (b) whole tissue sections are 2.2 cm x 2.4 cm, SLIM is stitched by 4785 images, H&E is 925 image stitching, scale: 100 nm. Calcium miniaturized breast cancer tissue: SLIM imaging, (c) nanoscale color bars, H&E imaging. (d) The entire slice is 1.6 cm x 2.4 cm, SLIM image is stitched through 2840 images, and the H&E is stitched through 576 images.
5ЎўReference
1ЎўZ. Wang, L. J. Millet, M. Mir, H. Ding, S. Unarunotai, J. A. Rogers, M. U. Gillette and G. Popescu, Spatial light interference microscopy (SLIM), Opt. Exp., 19, 1016 (2011).
2ЎўZ. Wang, D. L. Marks, P. S. Carney, L. J. Millet, M. U. Gillett, A. Mihi, P. V. Braun, Z. Shen, S. G. Prasanth and G. Popescu, Spatial Light Interference Tomography (SLIT), Opt. Exp., 19(21), 19907 (2011).
3ЎўH. Pham, H. Ding, N. Sobh, M. Do, S. Patel and G.Popescu , Off-axis quantitative phase imaging processing using CUDA: toward real-time applications , Biomed. Opt. Exp., 2 (7), (2011)
4ЎўT. Kim, R. Zhou, L. L. Goddard and G. Popescu, Quantitative phase imaging (QPI): Metrology meets biology, Photonics Journal, IEEE, 6 (2), 1, 2014
5ЎўPopescu G. (2011) Quantitative phase imaging of cells and tissues (McGraw-Hill, New York) Cell Growth and Proliferation
6ЎўM. Mir, Z. Wang, Z. Shen, M. Bednarz, R. Bashir, I. Golding, S. Prasanth and G.Popescu, Optical Measurement of cycle-dependent growth , Proc. Natl. Acad. Sci., 108 (32), 13124 (2011)
7ЎўM. Mir, A. Bergamaschi, B. S. Katzenellenbogen, and G. Popescu, Highly sensitive quantitative imaging for monitoring single cancer cell growth kinetics and drug response, PLoS ONE, 9 (2), e89000 (2014)
8ЎўB. Bhaduri, D. Wickland, R. Wang, V. Chan, R. Bashir and G. Popescu, Cardiomyocyte Imaging Using Real-Time Spatial Light Interference Microscopy (SLIM), PLoS ONE 8(2): e56930 (2013)
9ЎўG. Popescu, K. Park, M. Mir and R. Bashir, New Technologies for Measuring Single Cell Mass, Lab. Chip, 14, 646-652 (2014)
10ЎўR. Wang, Z. Wang, L. Millet, M. U. Gillette, A.J. Levine, and G.Popescu, Dispersion-relation phase spectroscopy of intracellular transport, Opt. Exp. 19(21), 20571 (2011).
11ЎўZ. Wang, L. Millet, V. Chan, H. Ding, M. U. Gillette, R. Bashir and G. Popescu, Ў°Label-free intracellular transport measured by spatial light interference microscopyЎ±, J. Biomed. Opt. 16, 026019 (2011)
12ЎўT. Kim, R. Zhou, M. Mir, S. D. Babacan, P. S. Carney, L. L. Goddard and G. Popescu, White-light diffraction tomography of unlabelled live cells, Nature Photonics (2014)
13ЎўM. Mir, S. D. Babacan, M. Bednarz, M. N. Do, I. Golding, and G. Popescu, Visualizing Escherichia coli Sub-Cellular Structure Using Sparse Deconvolution Spatial Light Interference Tomography, PLoS ONE, 7 (6), e38916 (2012).
14ЎўM. Mir, T. Kim, A. Majumder, M. Xiang, R. Wang, S. C. Liu, M. U. Gillette, S. Stice and G. Popescu, Label-free characterization of emerging human neuronal networks, Scientific Reports, 4, 4434 (2014)
15ЎўR. Wang, Z. Wang, J. Leigh, N. Sobh, L. Millet, M. Gillette, A. Levine and G. Popescu, One dimensional deterministic transport in neurons measured by dispersion-relation phase spectroscopy, J. Phys. Cond. Matt., 23, 374107 (2011).
16ЎўH. Pham, B. Bhaduri, K. Tangella, C. Best-Popescu and G. Popescu, Real time blood testing erythrocyte Function in Banked Blood, Scientific Reports, 4, 6211 (2014)
18ЎўM. Mir, K. Tangella and G.Popescu, Blood testing at the single cell level using quantitative phase and amplitude microscopy, Biomed. Opt. Exp., 2 (12), 3259 (2011).
19ЎўS. Sridharan, V. Macias, K. Tangella, A. Kajdacsy-Balla and G. Popescu, Prediction of Prostate Cancer Recurrence Using Quantitative Phase Imaging, Scientific Reports, 5, 9976 (2015)
20ЎўZ. Wang, A. Balla, K. Tangella and G. Popescu, Tissue refractive index as marker of disease, J. Biomed. Opt. 16(11), 2011
21ЎўR. Zhu, S. Sridharan, K. Tangella, A. Balla, and G. Popescu, Correlation-induced spectral changes in tissues, Opt. Lett., 36 (21), 2011
22ЎўH. Ding, X. Liang, Z. Wang, S.A. Boppart, K. Tangella and G. Popescu, Measuring the scattering parameters of tissues from quantitative phase imaging of thin slices, Opt. Lett., 36, (2011).
